Graduate Admission Prediction using Machine Learning

For a detailed view of the code, check out the GitHub repository:
View the Code on GitHub
Go Back To Menu
Graduate Admission Prediction Using Machine Learning
This project involves predicting the chance of admission to graduate programs using machine learning models. Leveraging features such as CGPA, GRE Score, and TOEFL Score, the analysis identified vital influencers and determined that a Logistic Regression model achieved the highest accuracy of 95%. Further, a threshold adjustment analysis fine-tuned predictions, showcasing the model's adaptability to specific requirements.
Objective
Building upon previous work where three distinct machine learning models were employed to predict the chance of admission for graduate students in software-related master's programs, the current objective is to conduct a comprehensive evaluation to determine the accuracy of each model. The aim is to identify and designate a champion model with superior performance in predicting admission probabilities. This project phase emphasizes refining and selecting the most effective predictive model for better decision-making in the graduate admission process.
Data Exploration
Dataset The dataset comprises 400 samples, each representing a student applying for graduate studies.
- Features include GRE Score, TOEFL Score, University Rating, SOP (Statement of Purpose) rating, LOR (Letter of Recommendation) rating, CGPA (Cumulative Grade Point Average), Research experience, and the target variable, 'Chance of Admit.'
Data Preprocessing
1. Handling Serial No
- Identified 'Serial No.' as an index column for students.
- Removed the 'Serial No.' column as it served as an index and did not contribute to the analysis.
2. Handling Column Labels:
- Identified and corrected columns with added spaces in the labels.
- Renamed columns 'Chance of Admit ' to 'Chance of Admit' and 'LOR ' to 'LOR.'
3. Cleaning Blank Spaces:
- I ensured the removal of any additional blank spaces from the dataset.
- This step was performed to enhance consistency and avoid potential issues related to column names.
4. Checking for Null Values:
- Checked for null values in the dataset using `df. isnull().sum()`.
- Confirmed that there were no null values in the dataset after preprocessing.
The preprocessing steps were crucial for ensuring the dataset's cleanliness, removing unnecessary information, and setting the foundation for subsequent exploratory analysis and machine learning modeling. The dataset is now well-organized, and any potential issues related to column names and missing values have been addressed.
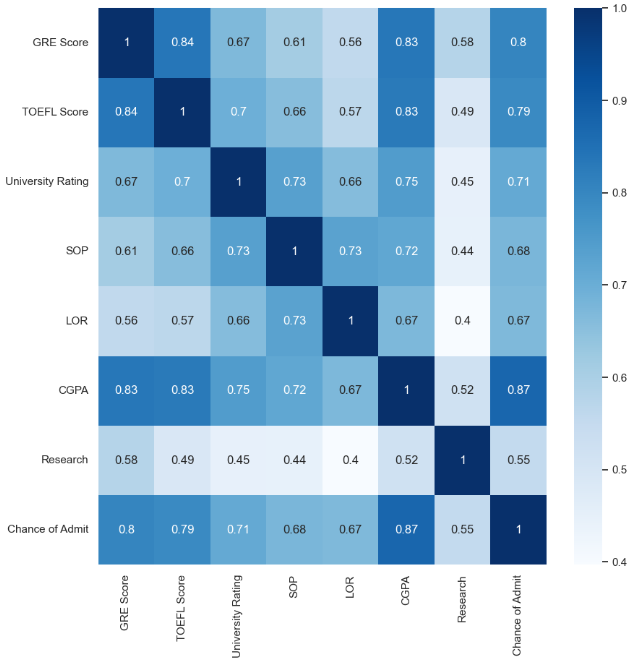
Correlation Analysis:
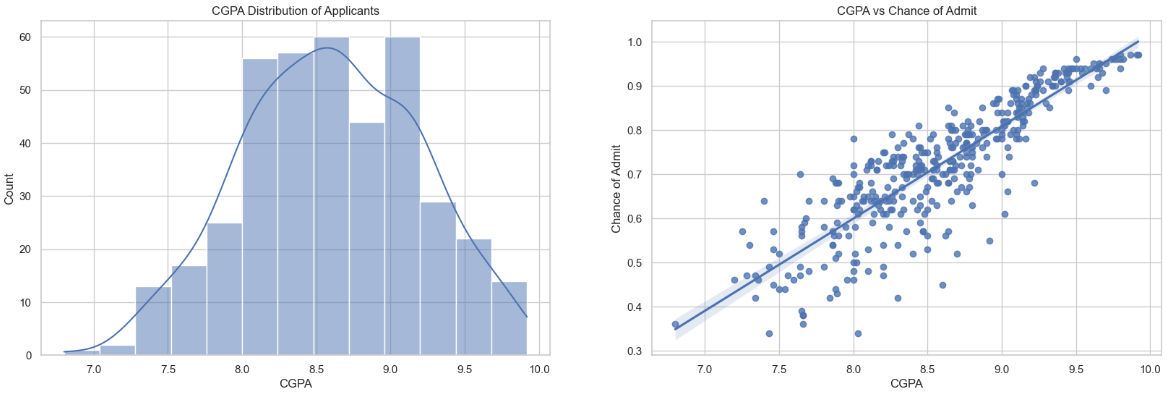
Heatmap: The heatmap illustrated the correlation between CGPA and the chance of admission.
Insight: A strong positive correlation is observed, indicating that higher CGPA scores positively influence the likelihood of admission.
Conclusion
• The analysis highlights that CGPA significantly impacts the chance of admission.
• Applicants with higher CGPA scores are more likely to be admitted.
Understanding the relationship between CGPA and admission probability will inform the development of machine learning models and contribute to accurate predictions during model training.
Feature-Specific Analysis: GRE Score
Description:
The Graduate Record Examination (GRE) Score is a standardized test widely used for graduate program admissions. This analysis focuses on the distribution and correlation of GRE scores with the chance of admission.
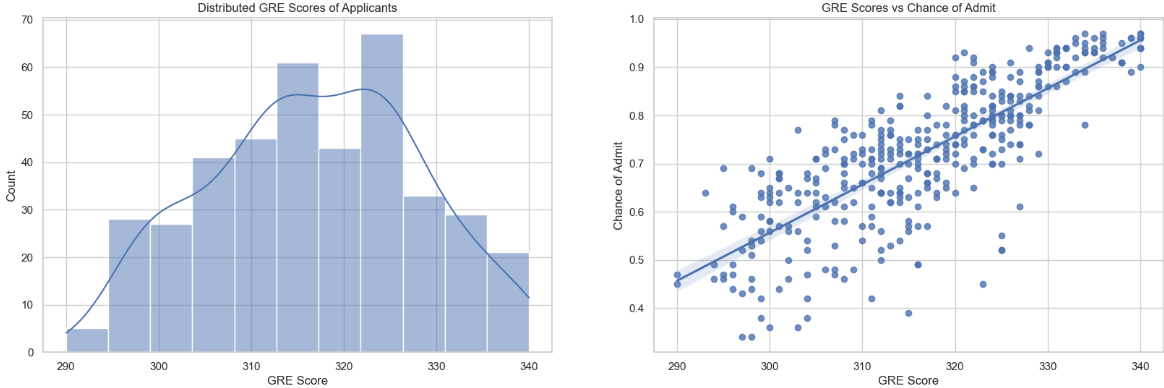
Distribution Analysis:
Distribution Plot: The distribution of GRE scores among applicants is depicted in the histogram, revealing the spread and concentration of scores.
Insight:
Distribution Plot: The GRE scores exhibit a distribution with a mean of 317 and a standard deviation of 11.5. This information provides an overview of applicants' overall performance in the GRE.
Correlation Analysis:
Scatter Plot: The scatter plot visualizes the relationship between GRE scores and the chance of admission.
Insight: While there is a notable positive correlation, it is observed that the correlation is not as strong as that of CGPA. Applicants with higher GRE scores tend to have an increased chance of admission, but other factors may play a significant role.
Conclusion:
- GRE scores contribute to the likelihood of admission, showcasing a positive correlation.
- While GRE scores are essential, the analysis suggests that other factors, such as CGPA, might impact the chance of admission.
Understanding the relationship between GRE scores and admission probability is crucial for refining machine learning models and enhancing predictive accuracy during model training.
Feature-Specific Analysis: TOEFL Score
Description:
The Test of English as a Foreign Language (TOEFL) Score is a standardized test for non-native English speakers applying to English-speaking universities. This analysis explores the distribution and correlation of TOEFL scores with the chance of admission.
Distribution Analysis:
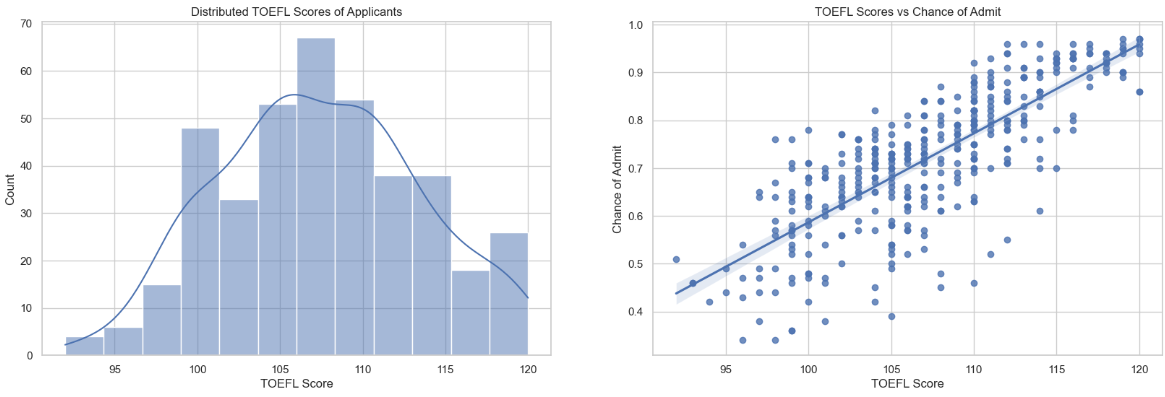
Distribution Plot: The histogram illustrates the distribution of TOEFL scores, providing insights into the range and concentration of scores.
Insight: The TOEFL scores exhibit a mean of 107 and a standard deviation of 6. The distribution reveals the overall performance of applicants in the TOEFL examination.
Correlation Analysis:
Scatter Plot: The scatter plot visualizes the relationship between TOEFL scores and the chance of admission.
Insight: Similar to GRE scores, there is a strong positive correlation between TOEFL scores and the likelihood of admission. Higher TOEFL scores are associated with an increased chance of admission.
Understanding the impact of TOEFL scores is crucial for developing accurate predictive models, ensuring that this information is appropriately considered during model training.
These insights contribute to the comprehensive understanding of the dataset and are essential for informed decision-making in the context of admissions prediction.
Let us explore how many applicants have research experience.
The majority of applicants have research experience. However, this is the least important feature, so it only matters whether a little has the experience.
Let us see the distribution of applicants coming from each kind of university.
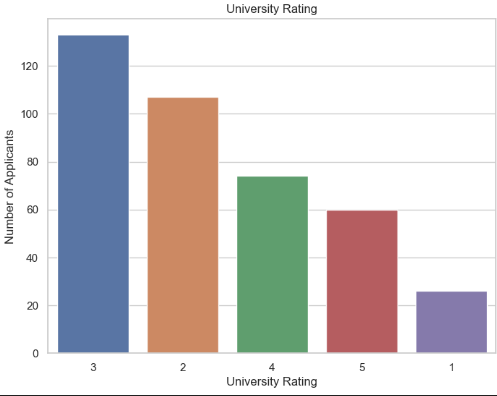
Most applicants come from tier 3 and tier 2 universities.
Conclusion:
- TOEFL scores play a significant role in determining the chance of admission, showcasing a strong positive correlation.
Model selection
Now we'll implement machine learning algorithms to predict the chance of admission. We'll use multiple techniques and eventually select the method with the best score. The methods used will be:
Logistic Regression
Support Vector Machine
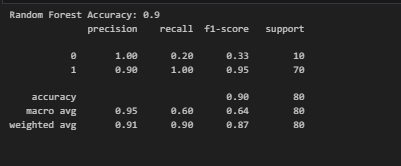
Random Forests
Comparing Scores
Let us put all the scores in a table and display their scores side-by-side.

selecting best algorithm
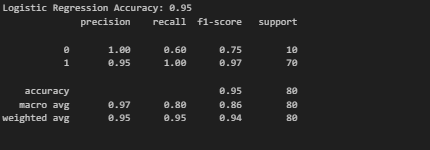
Logistic Regression Accuracy: 0.95
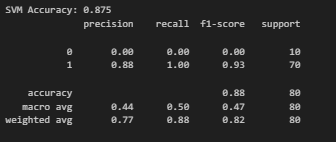
SVM Accuracy: 0.875
Random Forest Accuracy: 0.9
it seems the logistic regression model works well with the data
Threshold Adjustment and Model Evaluation
Method:
1. Logistic Regression Training
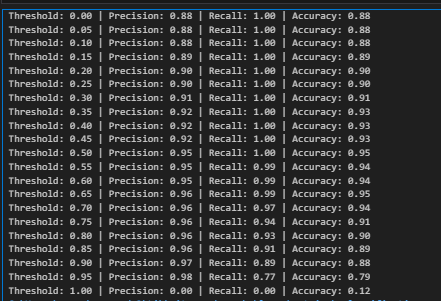
2. Threshold Adjustment (0 to 1 with increments of 0.05)
3. Performance Metrics: Precision, recall, and accuracy at each threshold.
Results
- Threshold: 0.00 - Precision: 0.88, Recall: 1.00, Accuracy: 0.88
- Threshold: 0.50 (Default) - Precision: 0.95, Recall: 1.00, Accuracy: 0.95
- Threshold: 0.95 - Precision: 0.98, Recall: 0.77, Accuracy: 0.79
Insights: Default threshold (0.50) provides a balanced trade-off. Adjust threshold based on specific use case requirements.
Recommendation: The default threshold (0.50) seems suitable for a balanced precision-recall trade-off.